Overview
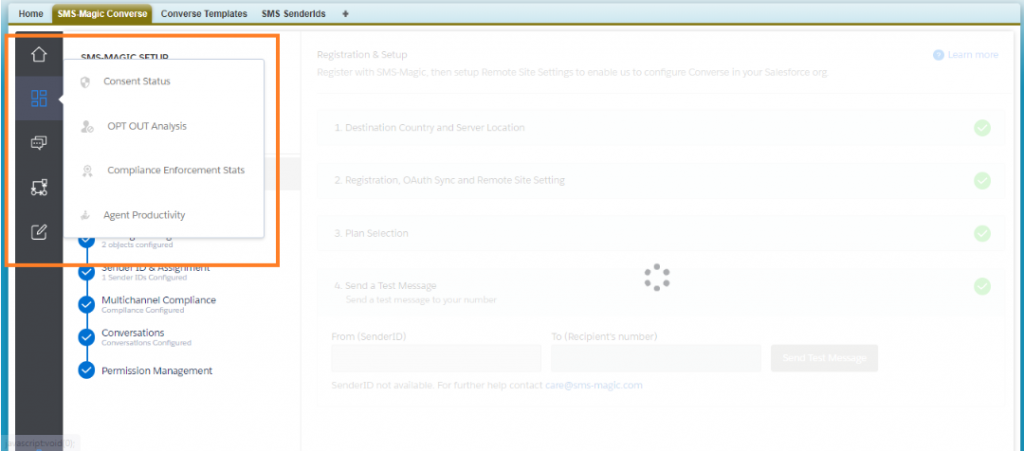
The global navigation bar gives you a single tab to display different dashboards and charts.
The 4 dashboards included in this section are:-
1. Consent Status dashboard
The Consent Status dashboard displays the overall consent status at the org level. It shows the number of known contacts against configured messaging objects who have provided the consent to receive messages. The displayed data is fetched in real-time.
2. Opt-out Analysis
The Opt-out Analysis dashboard shows the analysis for opted out numbers based on different dimensions, such as numbers opting out from different types of content, messaging sources, etc. The displayed data is not real-time. It is last updated based upon the batch processing schedule time that you have configured.
3. Compliance Enforcement
The Compliance Enforcement dashboard displays information about the compliance enforcement metric with respect to the number of times the opt-out compliance was enforced and sending of messages was blocked. The displayed data is not real-time. It is last updated based upon the batch processing schedule time that you have configured.
4. Agent Productivity
The Agent Productivity dashboard is visible to administrators only. The admin can view an agent’s progress based on conversation status, response time, pending replies from the agent, and customers. The measurements are filtered based on the owner of the conversation and represented in a tabular format. The displayed data is not real-time. It is last updated based upon the batch processing schedule time that you have configured.


